Market Updates
2nd of June 2020
Market Updates for June 2020
Despite ongoing global uncertainty surrounding the coronavirus, government policy implications, mass unemployment and bankruptcies, equity markets finished May strongly having edged sideways until mid-month. Reports of successful early stage vaccine trails, being developed by Moderna, on the 19th May triggered a bullish run for equities into month end. The NASDAQ, which increasingly represents retail investor flows and a post-covid technologically driven world, continues to outperform equities globally in USD. The Dow’s underperformance relative to the NASDAQ and SP500 endures which suggests that international capital continues to be in contractionary mode. The Indian Sensex was particularly weak in response to a spike in coronavirus cases and threat of another lockdown for its 1.3 billion population.
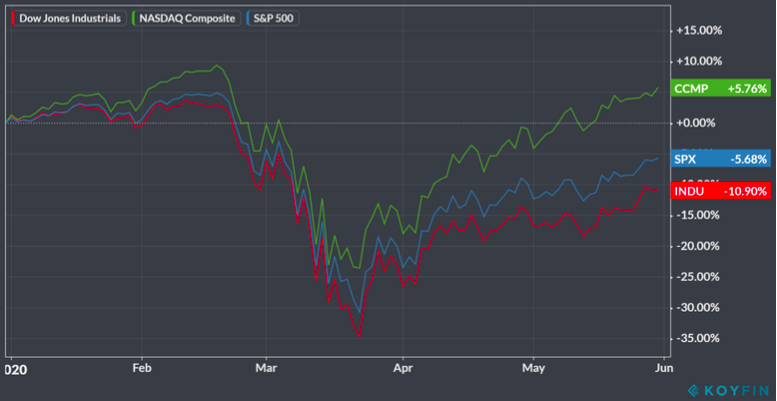 Chart Source: Koyfin.com
Developed market government bond yields also maintained a tight sideways range throughout May. The Italian-German 10 year bond spread (a useful proxy for government bond market stress) tightened considerably (40bps) during the latter half of May, reflecting the risk-on sentiment. This was also mirrored in a continued reduction in volatility (measured via the VIX index), having reached 80 mid-March, and has stabilized around 30 in recent weeks. Albeit this level is still double the historical average experienced during ‘normal market conditions’. Corporate debt had a blistering month considering the world has experienced one of the most remarkable rises in unemployment claims in modern history. The lowest credit quality bonds were of preference, in spite of the macro environment, with Emerging Market Corporate Debt (USD) and US High Yield CCC returning 4.2% and 5.6%, respectively. Conveniently this coincided with the height of the Federal Reserve’s primary credit program and initiation of its corporate bond buying program. Primary Credit reached $51 billion late April and is naturally reducing. The last week of May saw the first purchases of corporate bonds, which amount to $3 billion ($1.3bn of ETFs). Eligibility includes all corporate bonds rated as BBB on 23rd March (purchased directly or through ETFs), thus some of the bonds purchased are now rated as Junk (this includes Hertz which filed for Bankruptcy last week).
Looking at commodities, Gold fluctuated in May reaching a 7 year intraday high of $1765 per ounce, having broken out of a 5 year long bear market in Q4 2018. Gold proceeded to fall back into its 3 month range, finishing the month up 3%. If Gold maintains strong price action through the summer it would be a huge statement of intent, with June to August typically being a period of weaker demand from the Eastern buyer. Oil started the month at $15 per barrel, shortly after negative spot crude prices, and shot up 125% to $35 per barrel. The oil market continues to send mixed messages. The story at the beginning of May mirrored April with a lack of storage being the main concern. A full circle change has occurred since, with the market focusing on demand picking up through economic reopening’s and subsequent supply shortages due to severe capital expenditure cuts in the E&P industry.
Looking forwards, Jay Powell continues to deny the possibility of utilising negative rates, despite FED officials indicating that a second wave of coronavirus could cause a deeper recession. Such a scenario would be fertile ground for further FED action in the form of balance sheet expansion or interest rates cuts (current range 0-0.25%). Markets suggest negative rates are a possibility, with the 30-day Fed Funds futures having briefly priced in negative rates for early 2021.
Considering the US government’s fiscal commitments May and June have become important months for government funding. The treasury is raising just under $1 trillion of net new treasuries from Mid-May to Mid-June, and $230bn on 1-2 June alone. Under normal circumstances the market would provide the capital for funding, however given the increased stress in the financial system this may not be the case. Typically such periods cause reduced market liquidity to spill over somewhere, such as the REPO crisis in September 2019. The treasury general account (TGA – cash which the treasury holds at the Fed) is a good indicator of liquidity being sucked out of the system. The TGA often peaks between $350-400bn before market pressure appears, and worryingly the TGA is currently double this at circa $750billion. Once the market begins to feel the pressure of reduced liquidity the FED will have to re-increase their purchases to the emergency levels of March. The danger is that the FED, as per usual, acts in a reactionary manner (after a severe equity decline) rather than pre-emptively. Assuming the FED is now actively engaging as a market participant on a full time basis, these issuances should be funded with minimal stress, but Modern Monetary Theory will be in full force.
The EU began talks in May to clarify its relief package which at present amounts to 750 billion euros. The package is structured in the form of grants and loans, which continues to cause friction between Northern and Southern European policymakers. Progress on a vaccine will also be observed intently as the virus remains the prevailing market narrative for 2020. Risks continue to mount regarding a second wave of the coronavirus. For instance, South Korea has reported the highest daily increase in new cases for two month. The city of Wuhan (the perceived origin of the virus) has undergone another round of mass testing of its 6.7 million residents, after fears that a fresh outbreak of the virus could occur. Investors will be monitoring such events closely due to the likelihood of such outbreaks sending tremors to the West.
THINK PIECE: HOW FAR CAN THE FED GO?
How times have changed since July 2019 when the Federal Reserve returned to monetary policy easing, with the first of 3 rate cuts that year. The balance sheet expansion which ensued from September to December 2019 (Repo crisis), amounted to $400 billion dollars, and was nominally larger than QE1 of 2008-2009. Nevertheless in the increasingly complex and interconnected financial system of today it is the relative increases that matter, not the nominal amount. Notwithstanding the FED embarking on circa $3 trillion of balance sheet expansion since March, this amount is still sizeably less on a percentage basis than the QE1. Given the issues surrounding global liquidity, USD shortages and global indebtedness are much more severe today than 12 years ago; one would assume the FED’s balance sheet naturally must become significantly larger. During the 3 month period beginning in December of 2008 (the beginning of QE1) the FED’s balance sheet grew by 150% (see the below graph). Subsequently by the close of 2011 the FED’s balance sheet expansion reached 300%.
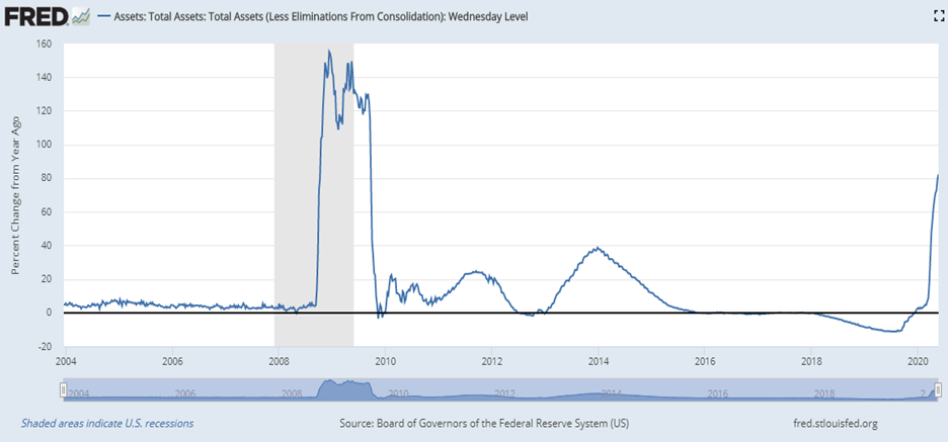
Chart Source: St. Louis Fed
In comparison to 2020, the 3 month period since February saw the FED’s balance sheet expand by 80%. Bearing in mind that total US government debt to GDP was 50% pre-2008, and is now racing above 100%. The total outstanding US debt has also increased by 70% in that same time period. Without going into the intricacies of the global debt complex, it is clear to all observers that risks around global debt have escalated. With relative debt levels much larger than pre-2008, one could hardly dispute that the FED’s balance sheet would have to increase to adequately reflect this, and more. If the 2020 balance sheet expansion matches that of the first year of QE1 then this would equate to total balance sheet assets of $10 trillion. Factoring the rate expansion from 2008-2015 then we could see total balance sheet assets reaching $18 trillion. But with systemic risks markedly larger than previously, it is ultimately impossible to put an upper limit on balance sheet size.
The greatest opportunities in financial markets arise during periods of change, and global central bank policy adjustments are factors which can change the course of markets for years afterwards. During such periods of monetary change, as is currently being experienced, it is not uncommon for market participants to express policy concerns. A popular narrative is that the value of money will be reduced due to the excessive use of the printing press. Gold and (recently) Bitcoin investments, which at times can protect the value of fiat currency during periods of currency debasement, can have a place in long term portfolios.
Bonds intuitively wouldn’t fare well in such an environment, and is one asset class we think is misunderstood given the current mainstream narrative. The consensus view is that during periods of heightened volatility in global markets and/or political tensions, there would be a ‘flight to quality’. This is often the case, but this assumption of higher bond prices (lower yields) in response to increased risks does not always hold during periods of liquidity injections. The below graph overlays the 30 year US treasury rate against the Federal Reserve’s total assets on balance sheet (representing liquidity injections). Once the data representing the FEDs total asset on balance sheet is lagged by 3 months a correlation develops around monetary policy pivots. After the balance sheet expansion of 2008-09 and 2012-13 yields reversed quite sharply despite the consensus view of a ‘flight to quality’. Despite the precedence that the Fed has set in doing whatever it takes to support asset prices and with markets pricing in negative short term rates, investors should be aware of such developments given the historical legacy.
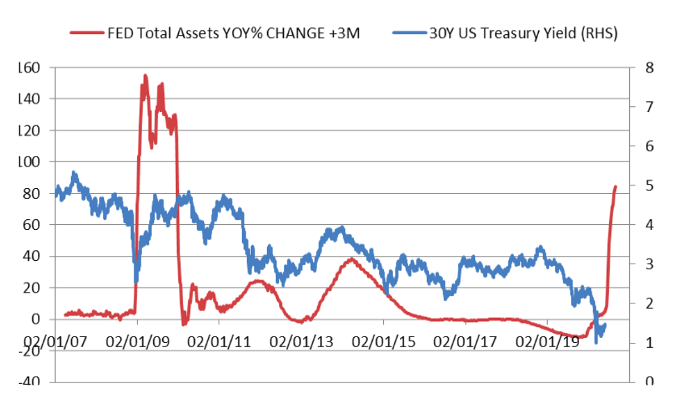
Chart Source: St. Louis Fed
The People’s Bank of China continues to be the odd man out in terms of monetary policy, with its balance sheet contracting since 2015. Each global economic slowdown of the last 20 years has seen considerable PBOC liquidity injections, and one would assume history would repeat itself. Despite the PBOC’s perceived idleness, it has reduced bank required reserve ratios (RRR) 12 times since 2018, freeing up around $1 trillion dollars for commercial lending. Three RRR cuts have already occurred in 2020, reducing the RRR to 9.4% from 14.5% in 2018. This is in an interesting case study in the differing approaches of Chinese and American Monetarists. Admittedly China’s economy is not as financialized as the USA, but it is still interesting that the PBOC has chosen to tackle China’s ‘main street’ before their public markets. However, China is not immune from the pressure of falling asset prices. Any further severe market disruptions would see the PBOC pressured into expanding its balance sheet. Unless there are more severe political undertones at play, with the PBOC sitting back and allowing the Federal Reserve to print their way into a lack of creditability.
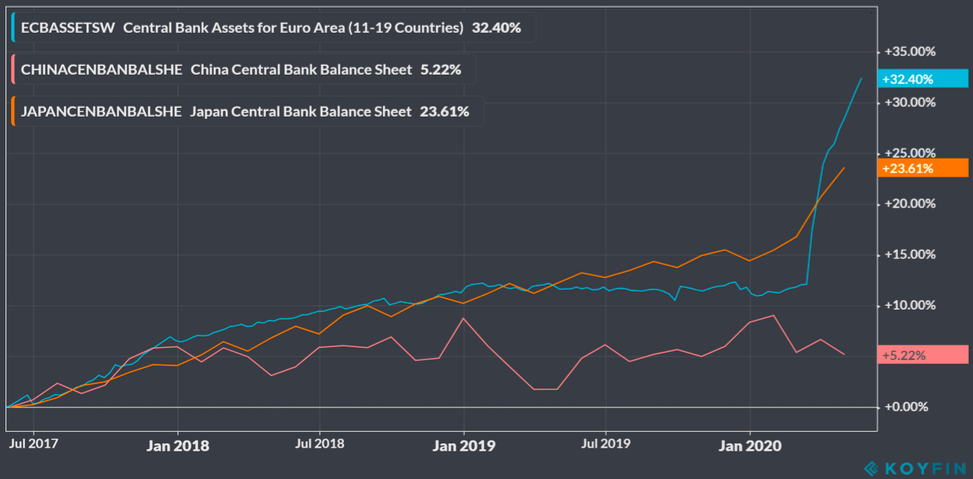
Chart Source: Koyfin.com
“The global economy will recover, but the timing and strength of the recovery are highly uncertain. Government policy responses around the world will be critical determinants of the speed and vigour of the recovery.” Ben Bernanke – January 2009
“The expectation of gradual policy normalization should reduce the likelihood of outsized movements in interest rates.” Jerome Powell – November 2017
Government policy responses’ causing a recession in peacetime has to be a first in modern history. Irrespective of ones views of the severity of coronavirus it is government specific responses that result in us being where we are today. Despite Ben Bernanke’s short comings, the above quote is spot on and applies well to 2020, especially as a ‘second round’ of policies
will be required to reignite the economy once we are rid of the coronavirus. Compare this to one of his successors’ quotes, indicating the linear approach taken by monetary policymakers. This approach can now finally be considered flawed as monetary policy was not in the realm of being ‘normal’ when policy easing was re-introduced in 2019. Thus it is important to remember how swiftly the methods and size of monetary policy approaches can change, irrespective of the words which are uttered by the mouths of central bankers. One should be prepared for all possible scenarios, especially as there is no cap on the amount and methods of monetary policy that can be used.
Download this Market Update
Disclaimer
This report was produced by Global Preservation Strategies (“GPS”). The information contained in this report is for informational purposes only and should not be construed as a solicitation or offer, or recommendation to acquire or dispose of any investment. While GPS uses reasonable efforts to obtain information from sources which it believes to be reliable, GPS makes no representation that the information or opinions contained in this report are accurate, reliable or complete. The information and opinions contained in this report are provided by GPS for clients only and are subject to change without notice. You must in any event conduct your own due diligence and investigations rather than relying on any of the information in this report. All figures shown are bid to bid, with income reinvested. As model returns are calculated using the oldest possible share class, based on a monthly rebalancing frequency and all income being reinvested, real portfolio performance may vary from model performance. Portfolio performance histories incorporate longest share class histories but are either removed or substituted to ensure the integrity of the performance profile is met.
The information contained within this website is subject to the UK regulatory regime and is therefore primarily targeted at customers in the UK. The information contained within the websites does not constitute investment advice or a personal recommendation for any product and you should not make any investment decisions on the basis of it. The value of investments and the income from them can fluctuate and it is possible that investors may not get back the amount they invested.
Global Preservation Strategies Limited is registered in England and Wales No 07354963 and authorised and regulated by the Financial Conduct Authority (No. 568328). GPS Wealth is a trading name of Global Preservation Strategies Limited.